Defining an input model
Consider a toy gene regulatory network with a series of mutual inhibition motifs as illustrated below:
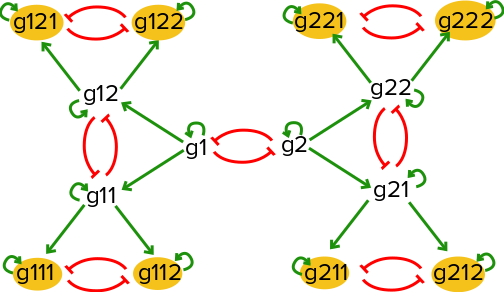
If there is an equal probability of taking either the left hand branch or the right hand branch starting at (g1=high,g2=high), this network will result in 8 distinct steady states, with one of the eight extreme genes being active in each steady state.
BoolODE can be used to generate gene expression data of a sample of cells undergoing a developmental process controlled by a gene regulatory network with a wiring diagram as shown above.
The above network diagram can be represented as a Boolean model as follows:
Gene  Rule
g1    ( g1 ) and not ( g2 )
g2    ( g2 ) and not ( g1 )
g11   ( g1 or g11 ) and not ( g12 )
g12   ( g1 or g12 ) and not ( g11 )
g21   ( g2 or g21 ) and not ( g22 )
g22   ( g2 or g22 ) and not ( g21 )
g111  ( g11 or g111 ) and not ( g112 )
g112  ( g11 or g112 ) and not ( g111 )
g121  ( g12 or g121 ) and not ( g122 )
g122  ( g12 or g122 ) and not ( g121 )
g211  ( g21 or g211 ) and not ( g212 )
g212  ( g21 or g212 ) and not ( g211 )
g221  ( g22 or g221 ) and not ( g222 )
g222  ( g22 or g222 ) and not ( g221 )
In order to test BoolODE, copy the rules above into a file, say multistate.txt,
in the /data folder in the BoolODE folder.
Note
BoolODE expects a tab separated rule file! Make sure the
input file has tabs between the Gene and Rule column.
Notice that the g1<->g2 interaction is central to the behavior of
the model. Let us choose an initial condition such that these genes
have a medium/high value. Biologically, this can be interpreted as the
initial undifferentiated cells have genes g1 and g2 ‘ON’, and
all other genes ‘OFF’. We can specify this initial state by creating a file with the
following lines:
Genes Values
['g1','g2']   [1,1]
The first column takes a list of genes formatted like a Python list of strings. The second column takes a list of values to assign to the list of genes, again formatted as a Python list of values. Any gene not listed in this file will be assigned an initial value of 0 by default.
Let us save the initial condition specification in
/data/multistate_ics.txt.
Note
The initial condition file should also be tab separated. Also, pay attention to the capitalisation of the column names.
Tip
We recommend starting off with initial condition values between 0 and 2, since larger values might cause numerical instability.
Running BoolODE
A few more decisions before we get our simulated dataset of gene expression values:
How long do you want to simulate this model? Let’s choose 8 time units
How many cells do you want to simulate? 2000 seems like a good number.
Where would you like to store the simulation output? Say,
./test/. BoolODE will create any folders that don’t already exist.Do you want to speed up the simulations by running simulations in parallel? Yes!
One last option that we will add is --sample-cells, which will instruct BoolODE
to sample one cell from each simulated trajectory.
This is all we need to call BoolODE on this model! The following directive puts together all the information collected so far
python src/BoolODE.py --path data/multistate.txt \    # path to the Boolean rules file
                      --ics data/multistate_ics.txt \ # path to initial condition specification
                      --max-time 8 \                  # maximum time of simulation
                      --num-cells 2000 \              # number of cells/simulations to perform
                      --outPrefix test/ \             # relative path to destination
                      --do-parallel \                 # do parallel simulations
                      --sample-cells                  # sample one cell from each simulation
For a full list of available options, see Command Line Options.
Working with BoolODE output
The simulations will take about 5 minutes to complete. At the end of a successful run, the output directory should look like this:
test/                              # User specified destination
|-- parameters.txt                 # Parameter names and values generated for input model
|-- ExpressionData.csv             # Gene expression dataset
|-- PseudoTime.csv                 # Simulation time of each sample time point/cell
|-- GroundTruthNetwork.csv         # Boolean network represented as an edge list
`-- simulations/
    |-- E1.csv
    |-- E2.csv
    ...
Where E1.csv, E2.csv, ... are individual simulations. Each column in these
files, the cell IDs, has the form E<simulation number>_<timepoint>.
Note
By default BoolODE will store the entire simulated time
course for every simulation. Specifying the --sample-cells
option will result in BoolODE sampling cells and creating an
ExpressionData.csv file with genes as rows, and cells as columns.
If the option is not specified, you can write a custom script to
sample cells from each simulation.
In order to visualise the entire dataset, we can carry out dimensionality reduction using t-SNE. A script like the one below is a good starting point for this.
import pandas as pd
from sklearn.manifold import TSNE
import matplotlib
import matplotlib.pyplot as plt

def vis(df, p):
    tsne = TSNE(n_components=2,perplexity=p).fit_transform(df.T.values)
    tdf = pd.DataFrame(tsne, columns=['t-SNE 1', 't-SNE 2'],index=df.columns)
    tdf.to_csv('test/tsne.csv')
    fig, ax = plt.subplots(1,1,figsize=(5,5))
    ax.scatter(tsne[:,0], tsne[:,1], c = [float(col.split('_')[1]) for col in df.columns])
    ax.axis('off')
    plt.tight_layout()
    plt.savefig('test/tree.png')

df=pd.read_csv('test/ExpressionData.csv', index_col=0)
vis(df, 400)
Here, the time point of each cell is inferred from the cell ID, and this information is used to colour each cell in the scatter plot. Darker colours imply early time points in the simulation. The output should look like the following
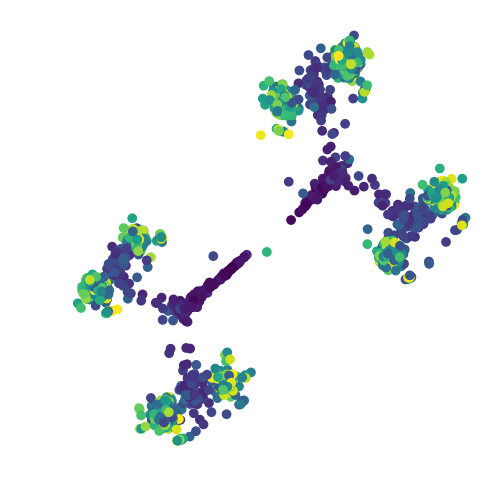
t-SNE visualisation of BoolODE output
Notice the eight steady state clusters! This dataset can now be processed further using the tools described in Generating inputs for BEELINE to produce input datasets for the BEELINE pipeline.